Downloading your EL-USB-1/EL-USB-1-LCD to view your pharmacy fridge data
Downloading your EL-USB-1/EL-USB-1-LCD to view your pharmacy fridge data |
The Problem: | |
| You have had your EL-USB-1 / EL-USB-1-LCD logging for a week in your fridge, you have just opened the fridge door and the red LED is flashing indicating an alarm has been breached. You need to download the data and review when the alarm went off and how long for, you haven’t had much experience with downloading the logger and need to produce a graph and table that shows when the breach occurred. So how do you go about doing this? | |
The Solution: | |
These loggers use the EasyLog software which would have been downloaded and used when you initially set up the logger and is detailed in the ‘Setting up your EL-USB-1/EL-USB-1-LCD’ to monitor your pharmacy fridge temperature’ application note. The menu that you will be presented with when you first open the EasyLog software is detailed below:
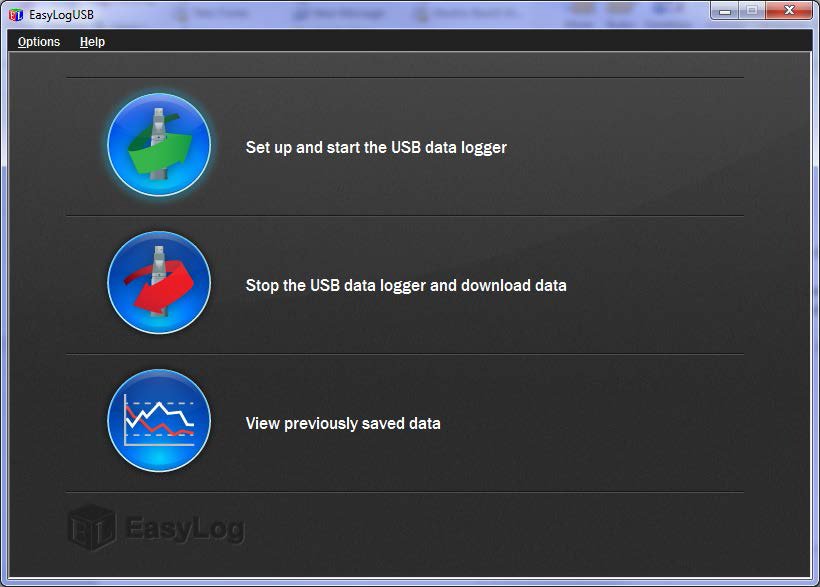
Figure 1: Initial Setup page within EasyLog
The first step for going about stopping and downloading the data is to click on the ‘Stop the USB data logger and download data’ shown below: 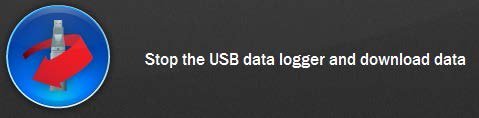
Figure 2: Button that will need to be clicked to stop the logger
When you click this you will be presented with the following screen: 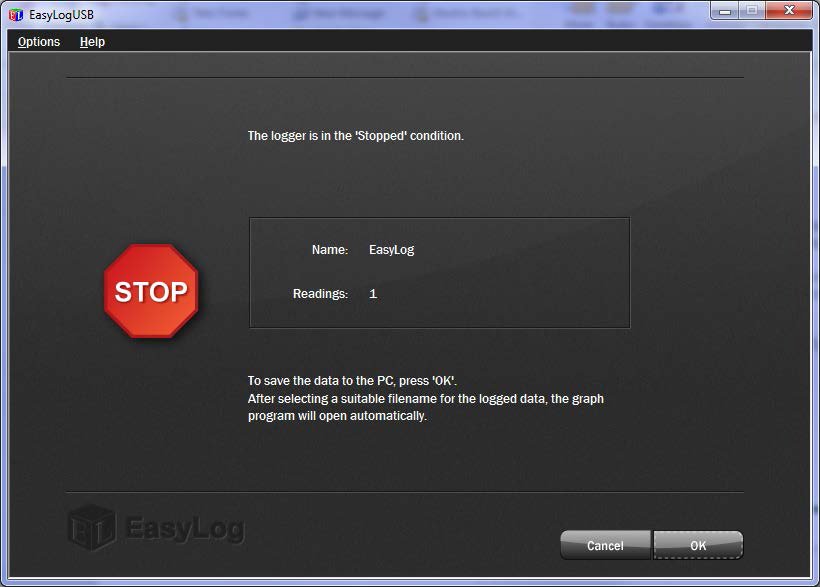
Figure 3: The window presented to allow you to save your data before graphing
Click ‘OK’ and you will be presented with a ‘Save as’ screen, save the file as a name of your choosing. We would advise naming it as a date range ie. 01-08-2014 to 04-08-2014 and then saving them to a dedicated folder. This will allow you to come back to a specified date range simply. Once you click ‘Save’ your graph will automatically open in a new window as shown below: 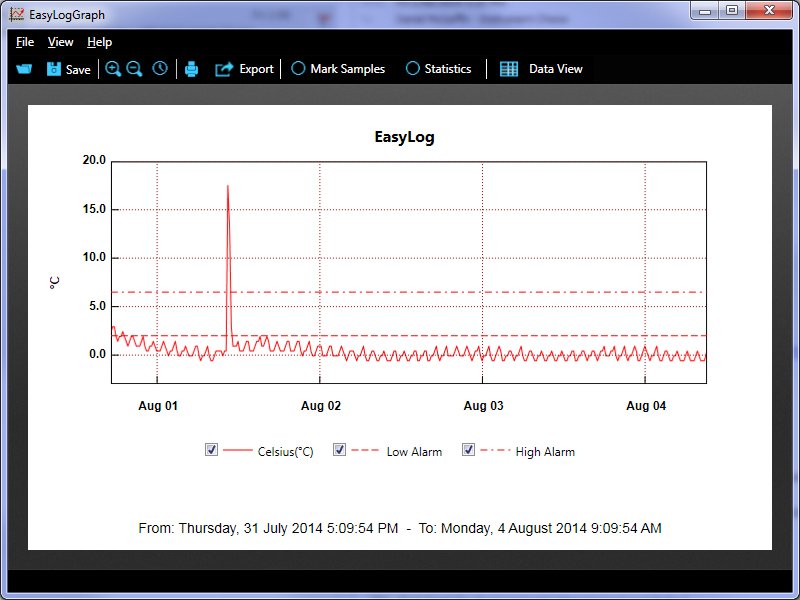
Figure 4: Graph of results
From the graph you will see that the alarms are indicated by dashed lines, these lines reflect the 2°C low alarm and the 8°C high alarm that were set when you first setup the logger. Your temperature readings will then be shown in a solid red line. This particular graph shows that the fridge has breached both the high and low alarms. The logger has breached the low alarm for almost the entire logging interval, whilst the high alarm breached the alarm between the 1st and 2nd of August. If you wish to view graph the high point you can zoom in on the section of the graph by highlighting it. This is shown below: 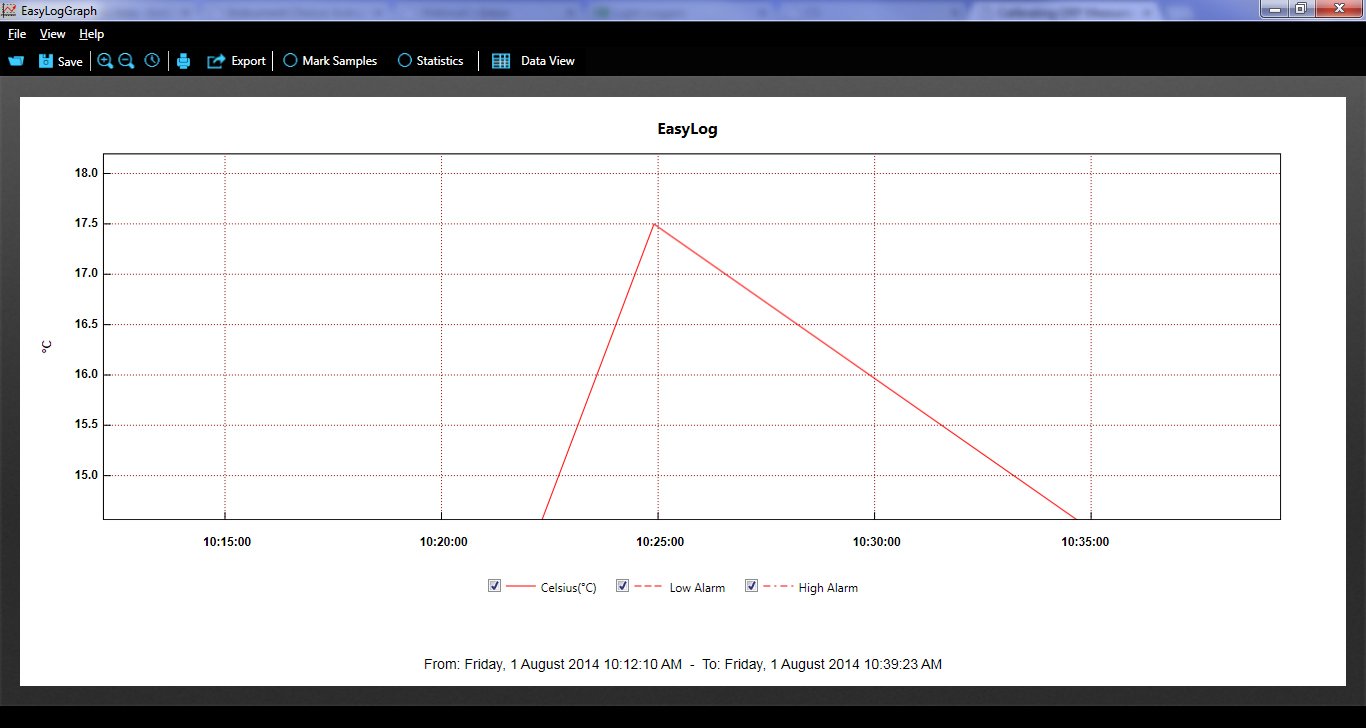
Figure 5: Graph zoomed in on High alarm
To further clarify when these breaches occurred you can change to data view by clicking the button at the top of the software. This is shown below: 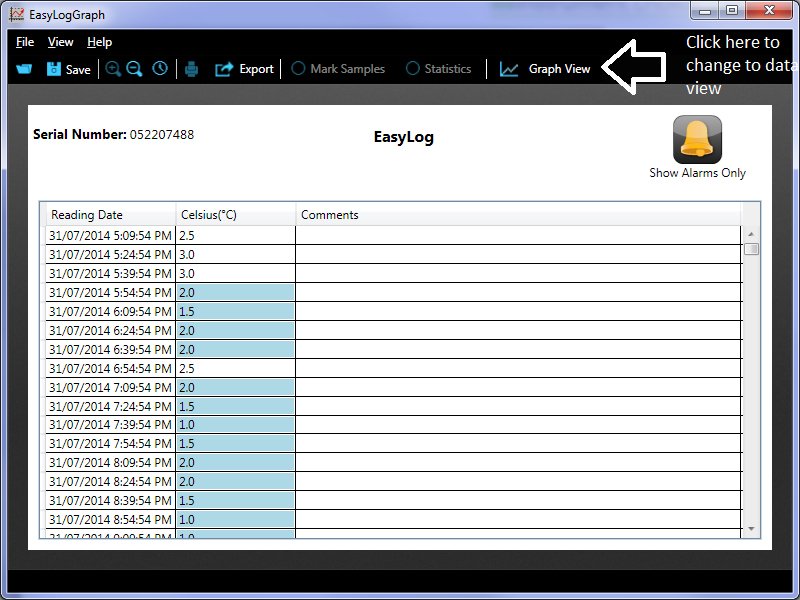
Figure 6: Tabular representation of data
You can then click on the ‘Show Alarms Only’ button:  This will produce your results in tabular format for the ‘Alarms’ only and this will show when the temperatures were breached and for the period they were breached for. This is shown below: 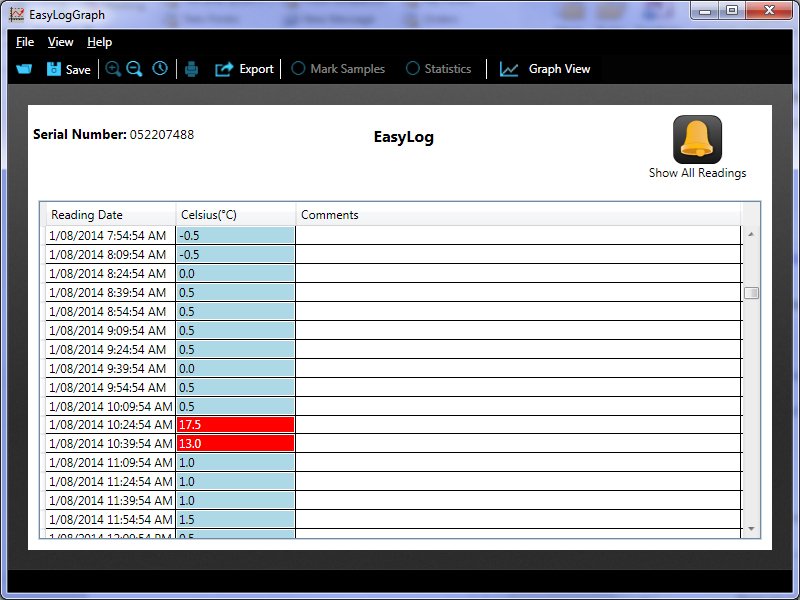
Figure 7: Tabular representation of alarms only
You can then either print both the graph and the table or you can save them into a dedicated folder for future reference. If you need any assistance downloading your data or reviewing your data please contact us via email or phone on 1300 737 871. |